 In this month's Spotlight, ten projects share how they are innovating teaching and learning with and about data in STEM education. They offer insights into the kinds of data students and teachers are engaging with, tools they are using to visualize and analyze data, instruments being used to measure knowledge and skills related to data literacy and data science, and more. In a blog post, Josephine Louie discusses the importance of preparing K–12 students to make sense of and reason about data, even as AI tools are increasingly capable of processing and synthesizing vast amounts of data, and highlights recent efforts to provide roadmaps for the development of data knowledge and skills.
In this Spotlight:
- Why Build K-12 Data Literacy When the Path Is Unclear, There’s No Time, and the Machines Are Coming Anyway? | Blog by Josephine Louie
- Featured Projects
- Boosting Data Science Teaching and Learning in STEM (PI: Kirsten Daehler)
- Building Insights Through Observation: Researching Arts-based Methods for Teaching and Learning with Data (PI: Kathryn Semmens)
- Building Teacher Capacity for Teaching Across Science Disciplines Using "Smart" Greenhouses (PIs: Mike Barnett, Ruth Kermish-Allen, Shenghua Zha)
- CAREER: Creatively Reimagining Engagements with Data in Biology Learning Environments (PI: Joshua Rosenberg)
- CAREER: Supporting Model Based Inference as an Integrated Effort Between Mathematics and Science (PI: Ryan Seth Jones)
- Exploring Data Science Through the Lens of Civics Education (PI: Traci Higgins)
- Fostering Virtual Learning of Data Science Foundations with Mathematical Logic for Rural High School Students (PI: Wanli Xing, Yuanlin Zhang)
- Invigorating Statistics Teacher Education Through Professional Online Learning (InSTEP) (PI: Hollylynne Lee)
- Learning How to Help Middle Grades Science Teachers Integrate Data Exploration and Sensemaking in the Classroom (PIs: Jonathan Griffith, Joshua Rosenberg)
- Supporting High School Students and Teachers with a Digital, Localizable, Climate Education Experience (PI: Lindsey Mohan)
- Additional Projects
- Related Resources
Why Build K-12 Data Literacy When the Path Is Unclear, There’s No Time, and the Machines Are Coming Anyway?
Josephine Louie, Principal Research Scientist, Education Development Center
 According to one source, the world will have gathered 181 zettabytes of data by the end of 2025 (Bartley, 2025). Unknown to me previously, I learned that a zettabyte equals 1 sextillion bytes of data, or roughly what can be stored on 250 billion DVDs. Clearly, the world hacontas been collecting vast amounts of data that can help to address almost any empirical question we may pose. How much have we spent on eggs over the past year? How likely will that tropical storm hit our area? What are the chances a pandemic will strike again in our lifetime?
Amidst accumulating repositories of data, emerging AI tools offer the promise of helping to process and synthesize information faster and better than humans can. But unless we decide to forfeit human judgment and to delegate our own data sensemaking to what AI algorithms feed us, we must ensure that current and future generations develop solid capacities to make sense of data. Calls to build data literacy among K-12 students have been mounting for over a decade. Such literacy may be even more important as the growth of AI makes it easier to offload our thinking to machines—with uncertain cognitive, social, and economic consequences (e.g., Kosmyna et al., 2025; Manning, 2024).
A national convening of researchers and educators gathered at the National Academy of Sciences in 2022 to discuss what K-12 schools have been doing, and what more is needed, to promote data literacy and foundational skills for data science (NASEM, 2023). Discussions revealed that educators have lacked a clear roadmap of essential data skills and practices that schools should support students to develop throughout the K-12 years. These conversations helped to motivate a group of STEM education leaders, organized by the Data Science for Everyone coalition, to produce such a roadmap....Read more.
Featured Projects
Boosting Data Science Teaching and Learning in STEM
PI: Kirsten Daehler | Co-PIs: William Finzer, Leticia Perez, Frieda Reichsman, Nicole Wong
Disciplines: Science, Mathematics
Grade Levels: Middle School
Project Description: This project develops and studies a professional learning (PL) model that builds teachers' capacity to integrate authentic data experiences into middle school math and science instruction. Our curriculum-agnostic PL course uniquely addresses both teachers' own data fluency and their pedagogical skills for data-rich instruction.
Through our research with middle school math and science teachers, we've identified that while educators value data instruction and recognize its importance for students' futures, they face significant barriers in implementation. To address these challenges, our innovation lies in three interconnected approaches:
- A Data Fluency model for professional learning that combines content learning through data investigations with analysis of classroom teaching cases and supported lesson planning within communities of practice.
- A "Data Doula" model that supports teachers as they translate their learning into practice, in which facilitators provide specialized help in navigating the selection of datasets, integrating data tools, and making pedagogical decisions to enhance data-rich learning opportunities for students.
- “Data Biographies” that make authentic data exploration accessible for classroom use by pairing curated datasets with pedagogical resources, such as context about data origins, suggested investigations, connections to standards, and implementation guidance.
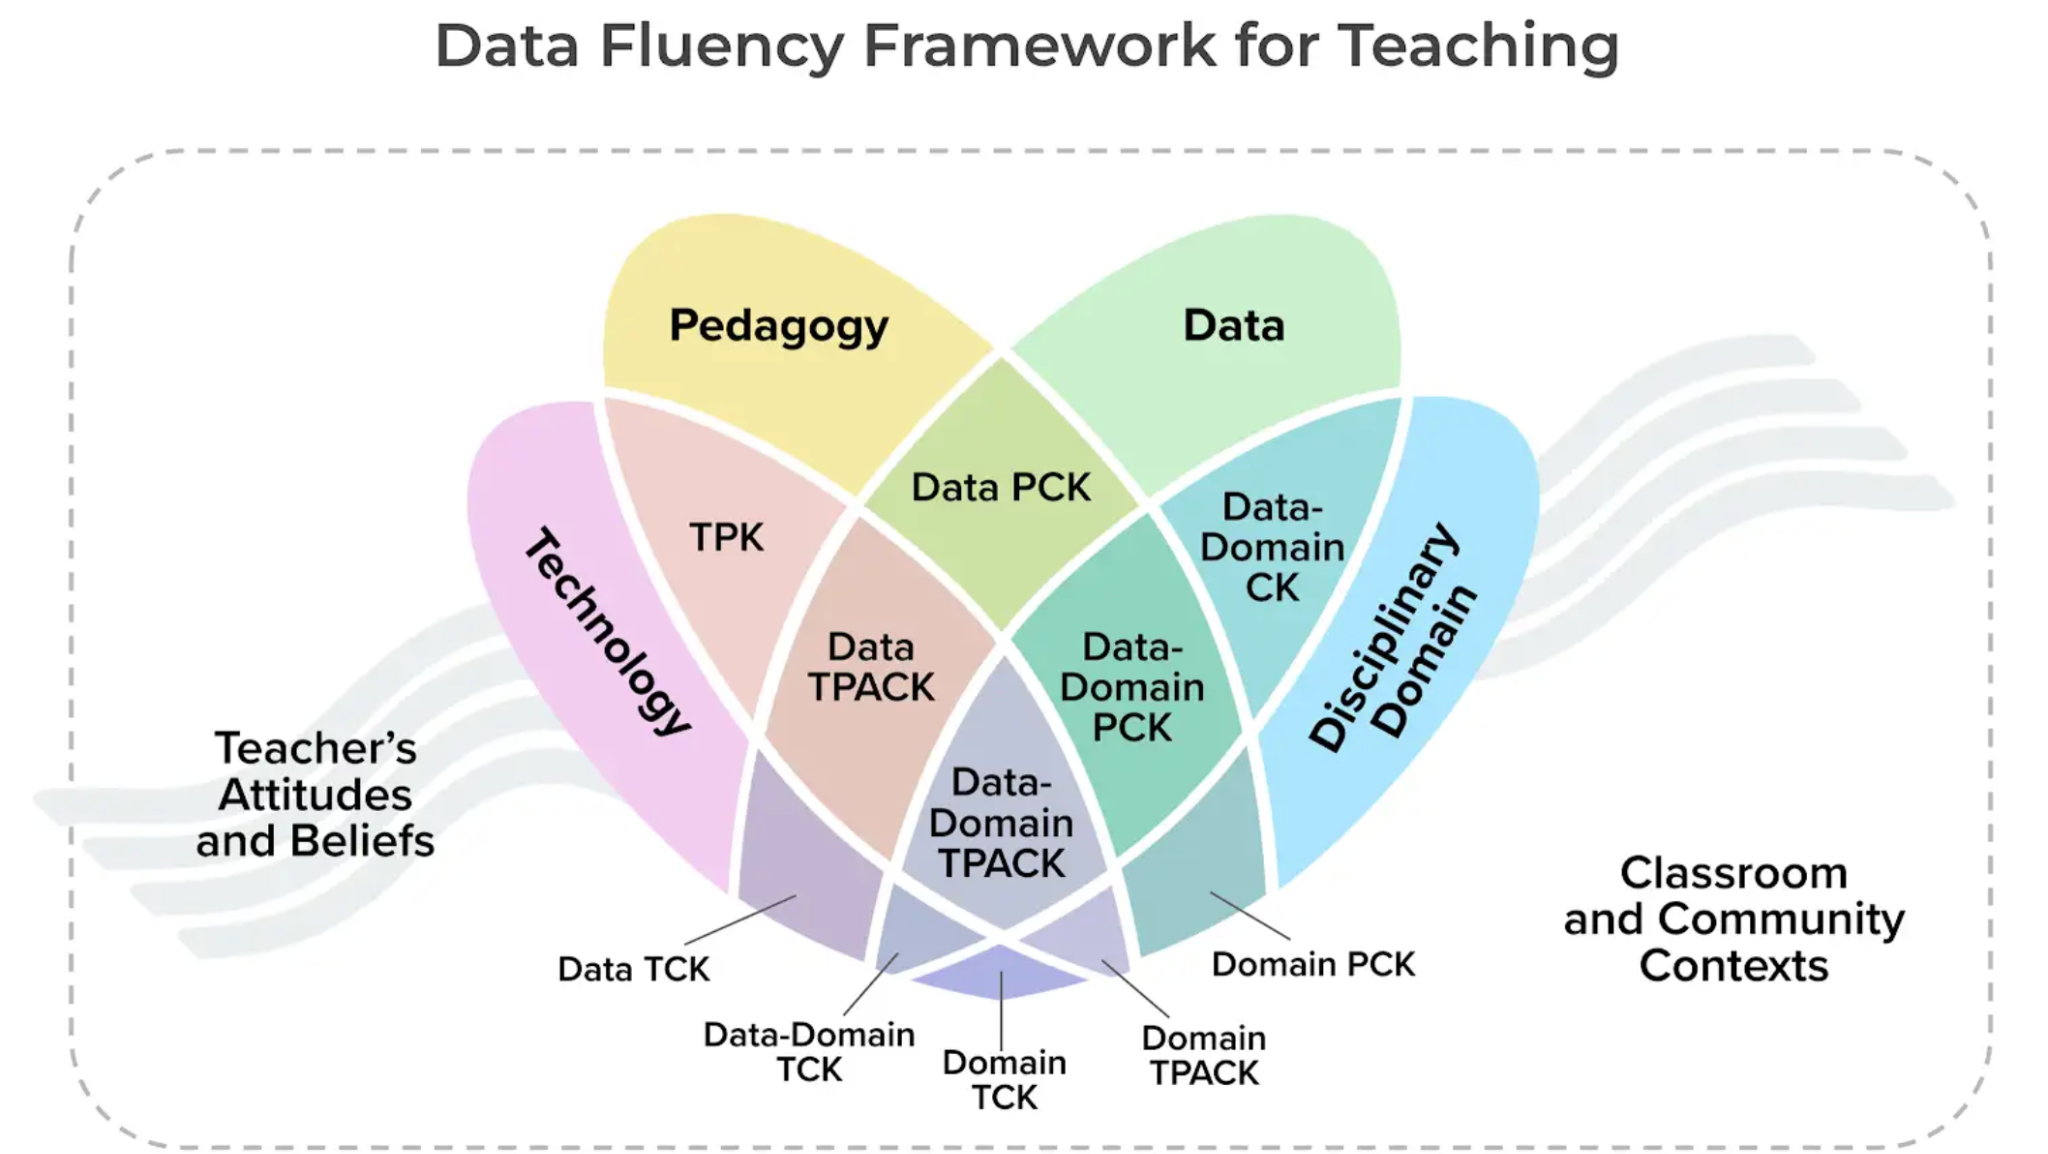
We have also developed a Data Fluency Framework for Teaching (DFFT), which advances existing models of teacher knowledge by explicitly articulating how technology, pedagogy, data, and STEM content must integrate for effective data-rich instruction. This framework provides researchers with a theoretical foundation for studying data education, offers PL developers a structure for designing teacher supports, and helps teachers recognize the multiple knowledge domains they must coordinate when planning data-rich lessons.
Data Types: Teachers and students work with authentic, real-world datasets spanning multiple disciplines. Examples include local weather station data for exploring extreme heat patterns, COVID-19 case data from students' own counties to model with mathematical functions, lake ice coverage records spanning 150 years to investigate climate change, and student-collected data such as diffusion experiments and survey data about student interests. We also utilize curated datasets on topics engaging to middle schoolers like roller coasters, ladybugs, and 3D foot measurements. These curated datasets are intentionally "Goldilocks-sized" — large enough to require meaningful analysis choices but not overwhelming — typically containing 4–17 attributes with varying complexity levels.
Instruments for Measuring Data Knowledge & Skills: We have developed a novel PCK (Pedagogical Content Knowledge) assessment that measures teachers' specialized knowledge for data-rich instruction. This 60-minute online performance task presents teachers with a realistic classroom scenario featuring a 7th-grade biology lesson about ladybug variation. Teachers analyze student dialogue and data visualizations, then respond to prompts that elicit two key dimensions of PCK:
- Analyzing Student Thinking — identifying students' data-related strengths and misconceptions from evidence in their work and discourse
- Planning Instruction — suggesting instructional next steps tailored to students' specific difficulties with concepts like mean and variability.
The instrument draws from established PCK frameworks while incorporating components specific to statistical and data reasoning. We also use pre/post surveys measuring teacher confidence, attitudes, and self-reported practices, along with student surveys assessing engagement and perceived learning with data.
Interdisciplinary Approach: The Data Fluency Framework for Teaching explicitly recognizes that data work requires integration across multiple knowledge domains — technology, pedagogy, data, and disciplinary content cannot be separated when teaching with data.
The Data Doula model directly addresses interdisciplinary challenges by helping teachers navigate the tensions between disciplinary learning goals and data learning goals. For instance, a science teacher using COVID data to explore exponential growth needs support connecting biological concepts (viral spread) with mathematical modeling (exponential functions) and data practices (cleaning, visualizing, interpreting real-world messiness). Similarly, math teachers using environmental datasets need help contextualizing the scientific phenomena behind the numbers.
Our Data Biographies intentionally provide datasets that can serve multiple disciplinary purposes, with each biography explicitly mapping connections to relevant math, science, and data science standards across grade levels. To that end, we organized the collection as a design-research testbed, using iterative cycles of teacher feedback and pilot use to develop and validate a framework — spanning dataset selection and right-sizing, provenance documentation, standards tagging, and tool integration — that can guide the creation of multidisciplinary, education-ready repositories. The same extreme heat dataset can support teaching weather systems in science (NGSS MS-ESS2-5), statistical measures of center and variability in math (CCSS 6.SP.B.5), or computational thinking in computer science. Each biography identifies these cross-disciplinary connections, helping teachers see how a single dataset can address multiple standards. Teachers choose entry points and depths of exploration based on their disciplinary focus while maintaining authentic data practices.
This interdisciplinary approach reflects the reality that data fluency isn't a standalone subject but a critical lens for understanding content across STEM. By explicitly supporting teachers to recognize and navigate these connections, we help them prepare students for a world where disciplinary boundaries are increasingly fluid and data serves as a common language across fields.
Challenges & Strategies for Addressing Them: A key challenge is that teachers often spend hours searching for, cleaning, and contextualizing appropriate datasets—time they don't have. Even with increased confidence and skills from PL, teachers struggle to translate their learning into classroom practice without ongoing support. Our Data Doula model addresses this by providing specialized facilitation that helps teachers make complex instructional decisions about balancing disciplinary and data goals, selecting appropriate tools, and scaffolding for diverse learners. Data Biographies reduce the dataset preparation burden while maintaining authentic data experiences. Communities of practice provide peer support and shared problem-solving, helping teachers see they're not alone in these challenges. In future work, we anticipate that the Data Fluency Framework for Teaching will help teachers recognize and articulate the multiple knowledge domains they're juggling.
Initial Findings: Our pilot study showed promising results in building both teachers' own data fluency and their pedagogical skills. Teachers demonstrated increased data content knowledge and skills, including stronger awareness of data analysis strategies, improved understanding of statistical concepts, and greater familiarity with productive habits of mind for working with data. Their pedagogical confidence also grew significantly: post-PL, 78% of teachers felt confident helping students create and explore multiple data representations (up from 22%), with similar gains across other instructional practices. All participating teachers provided students with more opportunities to engage with data and reported high likelihood of continuing data integration. Students demonstrated increased engagement, with one noting: "Previously, I was uninterested in statistics. . . Perhaps being a statistics analyzer [Data scientist] is a career path for me in the future."
Products:
- Project Website: The project website provides tools and resources to support data-rich teaching and learning, along with a collection of relevant project articles and presentations.
- Conference Presentations/Papers/Posters
- Chen, P., Wong, N., Elsayed, R., Perez, L, & Daehler, K. R. (2025, March 23–26). Building Teachers’ Capacity for Data-Rich Instruction: Impact from a Professional Learning Course [Poster Session]. Ninety-eighth annual international conference of the National Association for Research in Science Teaching, National Harbor, MD, USA.
- Perez, L. R., Daehler, K. R., Wong, N., & Elsayed, R. (2025, July 23–24). Collaborative inquiry into assessing teachers' pedagogical content knowledge for data fluency in STEM [Conference presentation]. ESTEEM Summit: Transforming Mathematics Teacher Preparation for a Data Science and Statistics Future, North Carolina State University, Raleigh, North Carolina, United States.
- Perez, L., Chin, C., Hunter-Thomson, K., Lionberger, K., Arnold, P., Finzer, W., Bullock, H., Salisbury, S., & Wong, N[NW2] . (2025, February 17–19). Bring your own data [Working session]. Data Science Education K–12: Research to Practice conference, San Antonio, Texas, United States.
- Wong, N., Elsayed, R., Perez, L. R., Del Core, C. A., & Daehler, K. R. (2025, March 23–25). The Data Fluency Framework for Teaching: A conceptual model of teacher knowledge for data-rich instruction [Poster Session]. Ninety-eighth annual international conference of the National Association for Research in Science Teaching, National Harbor, MD, USA.
- Arnold, P., Perez. L., & Johnson, S. (2024). Why does wonder work? [Paper presentation]. Meeting Within a Meeting: American Statistical Association. Virtual.
- Elsayed, R., Wong, N., Perez, L. R., Daehler, K. R., Chen, P., & Del Core, C. A. (2024, March 17–21). Assessing pedagogical content knowledge for data fluency for middle school STEM teachers [Paper presentation]. Ninety-Seventh Annual International Conference of the National Association for Research in Science Teaching, Denver, CO, United States.
- Perez, L. R., Salisbury, S., & Daehler, K. R. (2024, March 20–23). Using photographs and data stories to support data science in STEM [Workshop]. National Science Teaching Association Annual Conference, Denver, CO, United States.
- Wong N., Elsayed, R., Perez, L. R., Daehler, K. R., & Chen, P. (2024, March 17–21). Toward a theoretical framework for data fluency teaching and learning in middle school STEM [Poster session]. Ninety-Seventh Annual International Conference of the National Association for Research in Science Teaching, Denver, CO, United States.
- Perez, L., & Lionberger, K. (2023). Opening the door to data science in STEM classrooms. NextGenScience. https://ngs.wested.org/doortodatascience/
- Journal Articles
- Perez, L., Wong, N., Daehler, K., & Salisbury, S. (2025, October 1). Creating usable datasets for K–12 STEM education: A path to classroom data fluency [Manuscript submitted for publication]. Harvard Data Science Review.
- Perez, L., Reichsman, F., Salisbury, S., Chin, C., & McIntyre, C. (2025, August 25). Daylight data: Deepening Earth systems understanding with CODAP plugins. Science Scope, 48(5), 10–16.
- Perez, L., McIntyre, C., & Reichsman, F. (in press). Data biographies: A tool for integrating real-world data into classrooms. Statistics Teacher.
- Techniques and Technologies
- CODAP Color Class: This plugin includes a simulation to help students examine the relationship between day length, seasonality, and solar intensity. This technology augments the capacity native within CODAP V3 (beta release, Spring 2025) to treat color types as a class of data. This capacity improves the tool’s ability to create subgroups of data, increases control in data representation and analysis, and increases the types of data science lessons that can be created with the tool (e.g., photo/pixel analysis, connections to art, computer vision).
- Day Length Plugin: This plugin computes sunrise, sunset, daylight hours, solar angle, and intensity for any point on the globe and pairs the resulting dataset with a linked 3‑D Earth–Sun simulation.
- NASA Earth, Air, Water CODAP Plugin: This plugin retrieves dynamic data from the NASA POWER API for 19 attributes anywhere in the world. This tool is helpful for students engaged in Citizen Science programs and classroom primary data collection events.
- Updated NOAA Weather Data Plugin: The NOAA weather data plugin allows students to access historical NOAA weather station data.
- Data Biographies: Data Biographies are a digital resource designed to introduce educators to a curated dataset or data visualizations within a webpage.
![]()
Building Insights Through Observation: Researching Arts-based Methods for Teaching and Learning with Data
PI: Kathryn Semmens | Co-PIs: Amy Busey, Keri Maxfield, Hilary Peddicord, Jessica Sickler
Disciplines: Earth and Environmental Sciences, Data science, Visualization, Arts
Grade Levels: Middle School
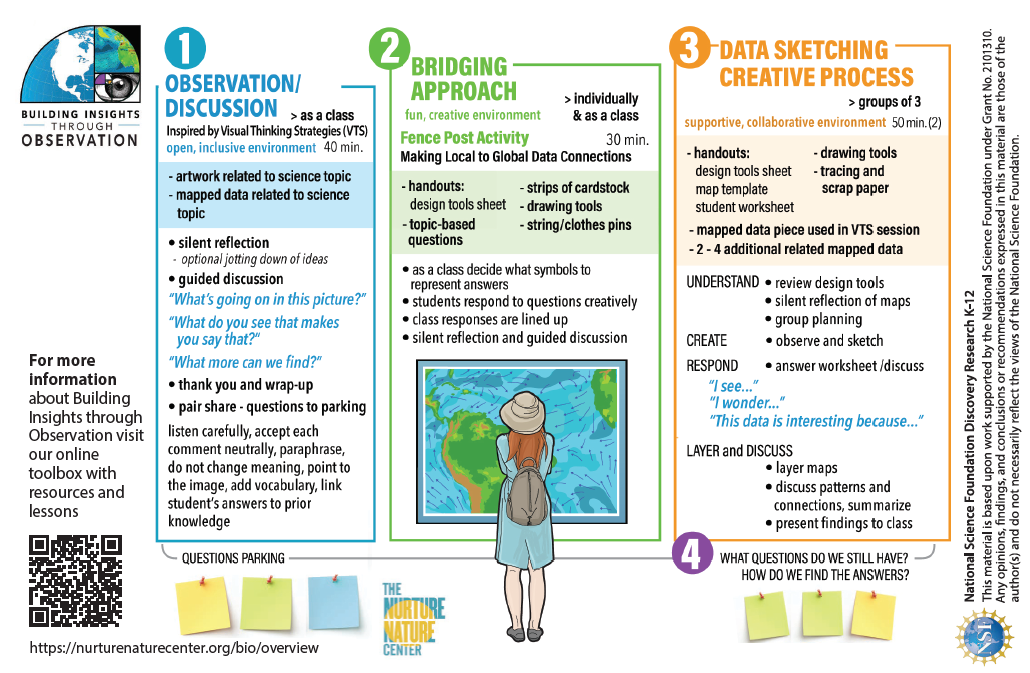
Project Description: The Building Insights through Observation (BIO) project combined arts-based instructional approaches with science content and data to support teaching and learning with geospatial data visualizations in middle school science classrooms. The project team, led by Nurture Nature Center, collaborated with10 teachers to develop, test, and refine a framework that integrates visual thinking, design thinking, and science content understanding to promote students’ data literacy, reasoning skills, and understanding of science phenomena. Teachers found the BIO approach especially effective for broadening participation in science class, improving students’ ability to recognize patterns and solve problems with data; and building critical thinking skills related to the design of data visualizations. The project created a BIO Teacher’s Toolbox, a digital toolkit featuring an in-depth overview of the BIO instructional approach and resources to support teachers’ design and use of BIO lessons in their classrooms. This work is important to help science teachers across the country, whose students are encountering a world where they are inundated with data – often data that has been put into a chart, graph, or other visualization by someone else. Teachers need effective strategies to help their students build the skills so that they can interpret visualized data, critically examine what it is showing them, what that might mean, and how it compares or contrasts with other information they know about how the world works.
Data Types: This project involves geospatial visualizations of a variety of earth and environmental science topics such as plate tectonics, weather, climate, and hazards, depicted on a global maps, as well as art images related to those topics.
Challenges and Strategies for Addressing Them: Although it is unexpected to include arts-based teaching in a science classroom, our work shows that it successfully offers students a new pathway into making sense of scientific data and information to become empowered consumers of scientific information as adults. Our experience and research suggests there is much more to be explored in this area, to create tools and techniques that are high-value for teachers, engaging for students, and result in meaningful science learning outcomes.
Initial Findings: The project website includes the BIO model and materials along with a Research tab that has Research Briefs describing our project findings.
Products:
- Project Website
- Semmens, K., Sickler, J., Maxfield, K., Goldner, M., Curry, D., Peddicord, H., ... & Carr, R. H. (2025). Building Insights Through Observation: Integrating Art and Science to Support Sensemaking. Science Scope, 48(2), 30-38.
- Research Briefs
- PD Secret Sauce: What the data told us about the critical elements of the entire PD process for creating professional change
- Classroom Implementation: The ways teachers implemented the framework and what they thought worked (or not)
- Shifts in Teachers: How the PD process impacted teachers’ mindsets, values, confidence, and practices
- Student Skills: Full Findings: What the data told us about how the BIO model affected student data literacy skills
- Student Skills: Key Findings: Key takeaways from analysis of student data about how the BIO model affected student data literacy skills
- Poster
Building Teacher Capacity for Teaching Across Science Disciplines Using "Smart" Greenhouses
PIs: Ruth Kermish-Allen, Mike Barnett, Shenghua Zha | Co-PIs: Rachael Dektor, Jacqueline DeLisi, Na Gong, Avneet Hira, Helen Zhang
Disciplines: Mathematics (Data Literacy), Science (Plant Science, Physics, Chemistry), Engineering, and Computer Science
Grade Levels: Middle & High School
Project Description: In our project, we aim to co-design and support middle and high school STEM teachers in developing transdisciplinary STEM learning experiences for students through the physical computing context of a Smart Greenhouse. Transdisciplinary STEM learning focuses on a specific real-world problem context, like the smart greenhouse, and traverses across STEM disciplines, emphasizing holistic learning. This project involves building an automated smart greenhouse equipped with sensors and actuators. The students then learn to code environmental sensors using a micro:bit and block-based coding to collect data and maintain the greenhouse's environmental conditions. The project’s curriculum comprises various pathways, focusing on core disciplines such as data literacy, engineering design, and computer science. Every pathway has a larger driving question.
In this project, middle and high school STEM teachers will participate in a two-year professional development program to develop an understanding of transdisciplinary learning and teaching. After familiarizing themselves with the basic modules of the smart greenhouse project, they adapt the project’s curriculum to implement it in their respective classrooms, based on their own expertise and their students' interests, throughout the academic year.
The data science pathway involves students learning to code, collecting data from sensors, and then analyzing the trends in the data in the context of this physical computing greenhouse project. Thus, through this project, we aim to understand teachers’ perceptions about transdisciplinary learning, their evolving confidence and practices as they implement the transdisciplinary curriculum in their classrooms, and its impact on students.
Data Types: The driving questions of the data science pathway can be: “What are the best ways to represent data to convince family members to set up a greenhouse at home?” or “How to use the data to recommend changes to the greenhouse design?” In this project, middle and high school students have the opportunity to code the micro:bit to collect data from air temperature and humidity sensors, light sensors, CO2 sensors, etc. They then analyze this data to find trends. Furthermore, using the collected temperature, humidity, CO2, and light data, students program the micro:bit to control the greenhouse's lights and fans, thereby maintaining optimal conditions for the plants. Thus, in this project, students work with data in a real, authentic context of the smart greenhouse. Additionally, they analyze the data to inform decisions that support the plants' growth in the greenhouse. The teachers also pose additional challenges for the students, allowing them to explore various aspects of the data from the greenhouse.
Visualization & Analysis Tools: The project’s curriculum incorporates data visualization tools such as CODAP and Google Sheets. However, we encourage teachers and students to use data visualization tools that they are comfortable with. In our previous experience, we found the CODAP software easy to use and to create visualizations, such as scatter plots and line graphs, which students mostly use to find trends in data while working on this project.
Interdisciplinary Approach: The core element of this project is to help STEM teachers co-design and implement a transdisciplinary STEM curriculum for the physical computing project. Especially, mathematics and science teachers implement (or aim to implement) the data science pathway with a focus on a transdisciplinary context that spans other disciplines, such as plant science, coding, engineering design, and technology.
Challenges in Physical Sciences Education & Strategies for Addressing Them: Brainstorming with STEM teachers who completed our first summer training institute highlighted specific practical challenges in implementing the transdisciplinary curriculum in their classrooms. Some of these challenges included managing the limited time well while working with students on this project, (dis)comfort of working with data science concepts, especially in science classrooms for some teachers, cleaning of collected data, and helping students develop the skill to make sense of the graphs generated using real-time data. The teachers who have implemented or plan to implement the data science pathway agree on the benefits of having authentic, real-world context, such as the smart greenhouse, for students to collect their data. This helps students relate to the data and better understand it.
Some solutions to address these challenges that the teachers have suggested are spending more time planning the project’s implementation, having discussions with students in smaller groups about reading and analyzing the graphs, etc. Additionally, the context of the smart greenhouse project helps science teachers work comfortably with data science concepts as data and its analysis are organically integrated into this project.
Initial Findings: The preliminary findings indicated that the project's physical computing context is helpful in supporting science and mathematics teachers in implementing the greenhouse project's data science pathway. Secondly, if the STEM teacher is comfortable working with data science concepts, then implementing the transdisciplinary curriculum with a data science focus becomes easy for that teacher. The preliminary findings also showed that many STEM teachers were enthusiastic about the data science pathway.
Teachers believed that combining physical computing with data science provided an authentic context for students to experience data collection, cleaning, and making sense of data using visualization tools. Further, given that many of our participating teachers are still developing their understanding of transdisciplinary teaching and learning in practice, the data science activities serve as a concrete example of transdisciplinary learning, where the context and driving questions guide students' navigation back and forth among disciplines. Lastly, we found that the data science pathway offers an easy entry point for teachers to engage more with transdisciplinary learning and teaching, as many teachers, particularly STEM teachers, feel comfortable working with data science concepts.
Products:
- ICLS 2025 Conference Proceedings (Virtual Poster): Phatak, J. U., Park, J. H., Perret, B., Shah, S. A., Beheshti, M., Hira, A., Zhang, H. Z., & Barnett, M. (2025). Role of a physical computing project for the flexible adaptation of the curriculum: An exploratory study. In A Rajala, A Cortez, R. Hofmann, A. Jornet, H. Lotz-Sisitka, & L. Markauskaite, 19th International Conference of the Learning Sciences (ICLS) Proceedings, (Vol. 2, pp. 2982-2984). ISLS.
- NSF DRK-12 PI Meeting 2025 Poster: How can we Build Teacher Capacity for Designing Transdisciplinary Learning Experiences?
- AERA 2024 Structured Poster: Phatak, J.U., Hira, A., Zhang, H. Z., Shah, S. A., & Barnett, G. M. (2024, April 11-14). Perceptions of Data Among Middle School Students: An Exploratory Study [Poster presentation]. American Educational Research Association (AERA) 2024 Annual Meeting, Philadelphia, Pennsylvania, United States. https://doi.org/10.3102/IP.24.2110610.
- Project Website
- YouTube Channel: This YouTube channel features various videos on working with different gadgets and coding the micro:bit for the same purposes.
- Science Scope Paper: Zhang, H., Jackson, D., Shah, S. A., Beal, K., Phatak, J., & Barnett, M. (2025). Seeding Future Scientists with Computational Thinking Through the Smart Greenhouse Project. Science Scope, 48(5), 58–66.
Suggested Reading: The literature suggests that, in data literacy, students should be able to work with authentic, real-world data, as it provides a context relevant to their lives while supporting their conceptual understanding (Kjelvik & Schultheis, 2019). Moreover, working with sensors to collect authentic data provides an added advantage to students, as they can collect large amounts of data in a short amount of time using these sensors, compared to them manually collecting the data (Lee & Thomas, 2011).
CAREER: Creatively Reimagining Engagements with Data in Biology Learning Environments
PI: Joshua Rosenberg
Disciplines: Science (Ecology, Environmental Science)
Grade Levels: Middle, High
Project Description: Project Creatively Reimagining Engagements With Data in Biology Learning Environments (CREDIBLE) is a research-practice partnership that is intended to advance how middle and high school students use data in science classrooms. The project has four core tenets: (1) place-based education, (2) an Ambitious Science Teaching approach to developing curricula, (3) the data investigation process, and (4) probabilistic thinking. These tenets are collectively intended to support middle and high school science teachers to integrate opportunities for their students to use data in more complex and personally relevant ways. We have been closely collaborating with more than two dozen educators from schools and districts across Tennessee through a summer professional learning experience held at the Great Smoky Mountains Institute at Tremont (in the Great Smoky Mountains) and follow-up professional learning opportunities and support throughout the school year. At its conclusion, this project will have introduced new teaching strategies, pen-and-paper and digital tools, and curricular materials for others seeking to advance how students use data in K-12 science education. In all, this work is intended to offer a scalable approach for K–12 science education that is data-rich, tied to teachers’ standard, and connected to place.
Challenges and Strategies for Addressing Them: We are focused on science and engineering practices related to working with data: analyzing and interpreting data, using mathematics and computational thinking, and planning and carrying out investigations. One tension that has emerged in this work is the challenge of collecting and analyzing authentic data sources. Though it is true (in our experience) that data is everywhere, both collecting or creating that data and analyzing it present often hard-to-anticipate challenges. For example, when we tried to support a teacher to access local data on water quality to augment the smaller data that their students collected, we found a number of data sources, but all required extensive cleaning and preparation to be useful; in some cases, the data was practically impossible to use! We are working with teachers to develop strategies and technological supports to make authentic but messy data more usable to them.
Scientific or Technological Advances Leveraged: One scientific or technological advance we are leveraging is in Bayesian statistics. Our approach to supporting probabilistic thinking is grounded in Bayesian data analysis methods, as such methods intrinsically yield probabilistic (rather than deterministic, i.e. “yes or no”) answers to questions. These approaches are increasingly relevant through a range of statistical software and we are working to bolster the accessibility of Bayesian data analysis by creating pen-and-paper approaches as well as a web-based application that can be integrated into or used alongside various data analysis platforms (e.g., CODAP, DataClassroom, and Google Sheets).
Initial Findings: We have developed an approach to make probabilistic thinking accessible to middle and high school students called “The ABCs of Data”. This approach captures the core elements of the Bayesian data analysis approach: (A) account for what you already know (express your initial confidence), (B) be open to evidence (consider how strong the evidence for your initial idea or hypothesis is), and (C) consider your confidence now (use Bayes’ Theorem to update your confidence in light of your initial confidence and the weight of the evidence) using the web application here. We also wrote a paper for The Science Teacher (Rosenberg et al., in press) on this approach.
We also wrote a paper on a different approach to Bayesian data analysis, one that is a bit more complex in that it requires using data (rather than analyst’s assessment of the weight of the evidence). This is described in Dogucu et al. (2024).
Products:
- Project Website
- Publications
- Dogucu, M., Kazak, S., & Rosenberg, J. M. (2024). The design and implementation of a bayesian data analysis lesson for pre-service mathematics and science teachers. Journal of Statistics and Data Science Education, 33(2), 177-188. https://doi.org/10.1080/26939169.2024.2362148
- Rosenberg, J., & Jones, R. S. (2024). Data science learning in grades K–12: Synthesizing research across divides. Harvard Data Science Review, 6(3). https://doi.org/10.1162/99608f92.b1233596
- Rosenberg, J., Kubsch, M., Sorge, S., Tautz, S., Pritchard, C+., Garner, A., & Xu, Z. (in press). Embracing uncertainty in science: The ABCs of data and the confidence updater. Science Scope. https://osf.io/rg6xb
CAREER: Supporting Model Based Inference as an Integrated Effort Between Mathematics and Science
PI: Ryan Seth Jones
Disciplines: We take an integrated approach to data literacy in middle grade science and mathematics classrooms that supports students to develop competencies in data visualization, statistics, and data modeling and to use these tools to generate knowledge by making inferences about ecological phenomena.
Grade Levels: Middle School
Project Description: We conduct design-based research to develop and study innovative instructional resources for middle grade mathematics and science teachers that support students to make inferences with data that are both personally and epistemically meaningful. Working with our partner mathematics and science teachers, we explore their curriculum and identify learning objectives related to data modeling and inference. We use this information to co-design data investigations that coordinate data modeling instruction across mathematics and science classes. As teachers implement these investigations, we collect evidence about student thinking and learning. We then use these findings to improve the investigations, support teacher learning, and develop design principles for supporting students to use data modeling approaches to explain variability in data. Currently, we are developing four data investigations in 6th and 7th grade science classes that are coordinated with instruction around data in mathematics classes. These investigations support students to use data modeling approaches to generate knowledge claims about ecological phenomena such as differences in plant communities, plant growth patterns, differences in local weather conditions, and differences in alligator snapping turtle populations. To assess student learning in these interdisciplinary investigations, we are developing five formative assessment tools that could be given in mathematics or science classes. We have also created a data investigation planning tool that describes different sources of variability students might encounter to help a teacher revise or design an investigation in which students engage with data in ways that are similar to STEM researchers.
Data Types: Students and teachers will create the data used in their investigation, but the nature and source of the data will differ based on the type of variation that the investigation focuses on. Students will collect data to explore variation from measurement error, variation across time, natural variation across ecological units (individuals, populations, etc.), and variation between different conditions. Depending on the investigation, they will create these data from plant communities on their school property, Wisconsin Fast Plants they grow in the classroom, local weather stations, or probability models they develop using CODAP to inform their inferences.
Visualization & Analysis Tools: We use the Common Online Data Analysis Platform (CODAP) to support students to work with data.
Instruments for Measuring Data Knowledge & Skills: We have developed five interdisciplinary formative assessment tools to help measure students’ developing understanding of variability. Item response theory was used to evaluate the assessment instruments’ reliability for evaluating the Explaining Variability construct using scores from the assessment. We are also using assessment items developed by Rich Lehrer and Mark Wilson.
Interdisciplinary Approach: We conduct joint professional development sessions for mathematics and science teachers. These sessions allow teachers to develop shared understandings about data instruction and to better coordinate their instruction. Additionally, our data investigation planning tool supports science teachers to plan for the mathematical resources students may use to make sense of the variability in their data.
Challenges and Strategies for Addressing Them: Coordinating instruction related to data across mathematics and science is challenging because schools are built to separate disciplines more than coordinate them. Science and mathematics communities use similar words in their goals but often have different understandings or vision for data instruction. So, developing interdisciplinary practices, like making inferences with data, across multiple years of schooling is the biggest challenge we face as a project. We have addressed this challenge by having mathematics and science teachers come together in joint professional development sessions to develop a shared vision around data instruction and by having mathematics teachers observe data instruction in science class and vice versa.
Initial Findings: Our results so far have helped us develop a better picture of how teachers think about students’ data use in their classes, which has informed our understanding of how to integrate instruction about data across mathematics and science. In addition, we have collected data on students’ classroom activities and thinking when using data in both their mathematics and science classes. This has informed our understanding of what ideas students are making use of and has contributed to the development of a new construct, Explaining Variation. Our preliminary findings include:
In mathematics classes
- Students began with explaining variation in measurement data as a result of people’s carelessness or mistakes. For example:
- "We are not all robots. We're not perfect." -Math Student
- Students then began to explain variation as result of measurement decisions and the phenomenon being measured. For example:
- “People might have used their measuring tools in different ways.”-Math Student
- Students used these ideas as a reference point throughout the unit.
In science classes
- Students drew upon many of the ideas about explaining variability generated from their earlier math classes unprovoked by their teachers. This included measurement errors, but also included differences in environmental factors. For example:
- "This might be because some had better sunlight and some of the plants that didn't grow as well might also have been human error like breaking the stem or not giving enough water or giving it too much." -Science Student
- Students began to coordinate the sources of variability with references to the distribution on a data display. For example:
- “So, the one that was all the way over the edge [of the light], is the 9’s”-Science Student
- Some students developed early multivariate thinking as they coordinated two variables to make claims.
Our partner teachers are experienced, veteran teachers and so we are studying how these mathematics and science teachers use discourse moves to support their students to make sense of data. Our preliminary findings suggest that teachers often used eliciting discourse moves, e.g., “what do you notice,” to give students opportunities to share their observations and thinking. Teachers then used discourse moves to highlight inconsistencies in student thinking or pose alternatives, e.g. “what if,” to support students to engage in sensemaking.
Products:
- Jones, R.S., Klukowski, L., & Scott, F.C. (2025, June). Integrated Data Project: Leveraging variable data to support student-generated explanations of weather. Discovery Research PreK-12 PI Meeting, Arlington, VA.
- Jones, R.S., Scott, F.C., Skelton, T., & Klukowski, L. (2025, March). Exploring strategies for engaging students with probability modeling in science classes. Data Science Education K-12, San Antonio, TX
- Klukowski, L. (2024, June). Integrated STEM: Student sensemaking across time. International Society of the Learning Sciences, Buffalo, NY.
- Jones, R.S, Salisbury, S., Scott, F.C., & Klukowski, L. (2024, April). Coordinating mathematics and science investigations to support students to explain variability. American Educational Research Association, Philadelphia, PA.
- Klukowski, L., Jones, R.S., & Scott, F.C. (2024, March). Using questions to reach across disciplines in an integrated STEM investigation. National Association for Research in Science Teaching, Denver, CO.
- Scott, F.C., Jones, R.S., Klukowski, L., Klukowski, R., Campbell, K., & Meza-Abarca, O. (2024, March). Interdisciplinary assessment of student thinking about variability across mathematics and science classes in middle school. National Association of Research in Science Teaching Conference, Denver, CO.
- Jones, R.S., Salisbury, S., Scott, F.C., & Klukowski, L. (2023, June). Integrated Data Project: The interdisciplinary practice of explaining variability during middle grades math and science investigations. Discovery Research PreK-12 PI Meeting, Arlington, VA.
- Salisbury, S. (2023, April). Conceptualizing place-based science education as a dance of agency. American Educational Research Association, Chicago, IL.
- Jones, R. S., Salisbury, S., Scott, F., & Shepherd, L. (2022, November). Teachers’ goals for seeing with data. Psychology of Mathematics Education North American Chapter. Nashville, TN.
- Salisbury, S., & Scott, F.C. (2022, March) Exploring the potential for place-based ecology lessons in middle school science classes. National Association for Research in Science Teaching, Vancouver, B.C.

Exploring Data Science Through the Lens of Civics Education
PI: Traci Higgins | Co-PIs: Andee Rubin, Kaylene Stevens
Disciplines: Data Science, Mathematics, Social Studies
Grade Levels: Middle School
Project Description: Data has an increasing presence and importance in our world - and, in parallel, it has become more urgent for students to learn how to work with data effectively. While engagement with data has traditionally been limited to math classes, educators are recognizing the importance of exploring data in science and social science classes. In this regard, social studies classes are perfect candidates because they deal with data-rich topics, even though current social studies curricula don’t often take advantage of the opportunity. This project explores the potential for building on current middle school social studies curricula to create richer data experiences for students. In particular, we focus on civic data: local, regional or world data gathered to examine social issues. We work with social studies teachers to co-design data-rich experiences based on what they are already teaching. Our goals for these co-designed lessons are to 1) deepen students’ data literacy; 2) help students develop a sense of empowerment with respect to data and 3) connect to students’ interests and concerns about issues that impact them and their communities. Our research explores the synergies and tensions in creating inquiry sequences that integrate data science and social studies educational goals.
Data Types: The main sources of data that have been integrated into lessons include:
- U.S. Census
- United Nations
- Gallup Poll
- Dollar Street
- Our World in Data
- County Health Rankings & Roadmaps
- Environmental Protection Agency
Visualization & Analysis Tools: Our conception of data inquiry engages critical thinking about the full data investigation cycle–interrogating how data was produced and exploring issues of measurement, identifying question(s) that can be addressed by the data; analysis of patterns revealed through data visualization; communicating how findings connect with contextual knowledge and potential civic actions. To support full investigations of multivariate data providing opportunities for students to dynamically create their own data visualizations driven by their own questions, we have used CODAP (https://codap.concord.org/), a free, easy to use data visualization platform that supports learners in working with civic data in dynamic and interactive ways. Tables, graphs, and maps are linked to help students explore how the different representations present the same data. At the 6th grade level, we used offline case cards representing a subset of countries in the Americas with data on attributes connected to sustainable development goals. Students explored their own questions by physically manipulating the cards to create their own visualizations. Additional tools that have been interwoven into classroom data inquiry sequences include a data platform provided by Census.gov as well as GapMinder (gapminder.org) including the historical data animation tool and Dollar Street.
Instruments for Measuring Data Knowledge & Skills: Our classroom research analyzes data gathered from meetings and interviews with teachers, classroom observations, student classroom work, student surveys, and artifacts from the co-design and development process. Our research questions focus on data concepts and practices that are foregrounded when working with civic data within the social studies context and features of the work that develop students’ agency in working with civic data.
Interdisciplinary Approach: We are primarily working with middle school social studies teachers, but some of our collaborating teachers have paired up with a mathematics teacher on their same grade level team. Their math “buddy” attended summer workshops with them to share in the learning experience. During the summer, teachers work collaboratively with a multidisciplinary research and development team to design a data inquiry sequence to extend exploration of curricular content. The main research component of the project follows the social studies teachers back to the classroom to examine how students engage with data inquiry within this context, but we also learn from the experience of working across disciplines on the co-design of the sequences during the summer workshop.
Challenges and Strategies for Addressing Them: The social studies classroom is a rich place to prepare students for a future world in which data is omnipresent. The school day structure, and the lack of co-planning time between disciplines, teachers’ limited experience with data inquiry, over-packed curricular pacing guides, and securing administrative buy-in to support classroom research are all challenges faced in doing this work. Providing support for teachers during the summer has been vital to overcoming those barriers. Our summer workshop created space for teachers across disciplines to engage as learners, reflect on data activities as educators, and collaboratively design data inquiry lessons while supported by a research and development team with expertise in both data science and social studies education. This was essential to developing a shared vision between teachers and researchers on how to engage students in data inquiry to support content learning goals within social studies. This also helped teachers advocate for this work with their administrators.
Initial Findings: Working at the intersection of social studies and data science education has highlighted important opportunities. Social studies teachers’ disciplinary commitment to critical thinking and contextualization supports students in bridging the gap between data and real-world phenomena. However, social studies teachers may have limited experience with data inquiry, and this can lead to over reliance on low level questions in student-facing assignments that are strongly focused on data. This is compounded by curricular materials that engage with data in cursory ways. Sustained collaborative work during the summer and coaching opportunities during the school year provided support as teachers integrated instructional practices for supporting critical thinking into their student-facing work with data. As our work together progressed, teachers adopted high level questions to support students in engaging with data and connected this to critical thinking skills students were developing as social studies scholars.
The social studies context naturally supports coordinating information about individual cases with information characterizing larger aggregates. In our classroom work, we found these shifts to a case level view often highlighted important context for understanding the data. However, at times, this tendency to focus on cases could undermine construction of an aggregate view and the process of extracting insights from general patterns in the data (Konold, et al, 2015). We found it important to think carefully about the construction of student-facing questions that draw attention to aggregate features of data–especially considering where data tended to “clump”, characterizing variation within the data, and noticing distribution patterns. This helped students move from a focus on salient features of individual cases to connecting contextual information about cases with more general patterns in the data.
Civic data can be aggregated (state level, country level) in ways that lose information about the variability of subgroups within. Additionally, data visualizations may cover a set of cases that don’t align with a question of interest, even though the attributes measured do. When seeking data visualizations from external sources teachers in our project struggled to find data that was structured appropriately to address questions they wanted students exploring. This highlighted the need to provide opportunities for teachers to critically examine the case structure of data and to consider what questions can be explored with data aggregated at different levels. In student-facing work we found it was important to create opportunities for students to consider the variation hidden beneath aggregated values and to critically consider what questions can and cannot be addressed by different data representations.
Products:
- Project Website
- Presentations
- Higgins, T., Stevens, K., Rubin, A., Hobbs, K. (2025, June 9-11). Civic Data Project: Lessons Learned from the Co-Design Process. Presented at the National Science Foundation Discovery Research PreK-12 PI Meeting, Arlington, VA, United States.
- Stevens, K. & Higgins, T. (2025, March 27–28). Integrating Data Inquiry with Social Studies Learning in Middle School. Presented at the Boston University Wheelock Annual Forum, Thriving in the Middle School Year, Boston, MA, United States.
- Higgins, T. (2025, February 17-19). Weaving data inquiry into the social studies curriculum through a collaborative co-design process. Presented at the Data Science Education K-12 Conference, San Antonio, TX, United States.
- Higgins, T,. Cadel, C., McGuigan, M., McWhorter, J., Stevens, K. (2024, Nov. 22-24). Tools, resources, and activities to support data inquiry and build data literacy. Presented at the National Council for the Social Studies Annual Conference, Boston, MA, United States.
- Higgins, T. (2024, April 4). Using CODAP to Explore Civic Data. Guest presentation at the professional development workshop, Data Literacy and Maps in the Classroom, Primary Source, Waltham, MA, United States.
Suggested Reading: Shreiner, T. (2024) Teaching Data Literacy in Social Studies: Principles and Practices to Support Historical Thinking and Civic Engagement. Teachers College Press.
Fostering Virtual Learning of Data Science Foundations with Mathematical Logic for Rural High School Students
PIs: Wanli Xing, Yuanlin Zhang | Co-PIs: Jie Chao, Barnas Monteith, Victor Sheng, Aaron Zimmerman
Disciplines: Computer science, Mathematics, Statistics, Data Science
Grade Levels: High School
Project Description: The LogicDS Project is fundamentally reshaping K-12 data science education by tackling two major challenges: access and foundational complexity. We target rural, underserved high school students who traditionally lack access to advanced STEM courses and teachers.
Our innovation lies in the LogicDS Core Framework, which uses mathematical logic as a unified "universal language" to seamlessly integrate the foundations of data science—computing, mathematics, and statistics—that are usually taught separately. This novel, principled approach reduces cognitive load and makes data science concepts more accessible through engaging virtual lessons based on real-world topics like social media and music. Initial results confirm this impact, with student familiarity soaring from 3% to 43% and 75% reporting they enjoyed the learning.
Crucially, we are innovating research about learning with data by analyzing student activity logs captured by our online platform. We employ advanced metrics like Shannon’s entropy and the Coefficient of Variation (CoV) on thousands of data rows to quantify and predict learning behaviors. This allows us to correlate flexible engagement patterns with higher performance, refine lessons, and ultimately, use this data to actuate real-time, individualized changes in the curriculum using future AI and recommender systems. LogicDS is not just delivering data science curriculum; it is engineering equitable and optimized learning experiences through rigorous data analysis.
Data Types: Real-World and Culturally Relevant Data Contexts: LogicDS lessons immerse students in authentic, real-world data that connects directly to their interests and experiences while grounding each activity in the mathematical logic and statistical foundations of data science. Across the six core online lessons, and the expanded 14-lesson 2025 version, students explore datasets drawn from music, social media, entertainment, and technology, allowing abstract ideas to become personally meaningful.
Students begin with familiar themes such as social media influencers, where they analyze subscriber counts and estimated earnings for popular creators like PewDiePie, MrBeast, and KSI. Working with “Jenna’s Data,” a fictional influencer dataset, students learn linear regression by predicting video income from view counts. In music-focused lessons, they examine global stars such as Taylor Swift, Selena Gomez, and Camila Cabello to understand functions, expressions, and measures of popularity using real YouTube view data.
Later lessons introduce more complex, numerical challenges using roller coaster and theme park data, where students visualize and model relationships, like predicting top speed from maximum height, through scatter plots and least-squares regression. Everyday contexts, including autonomous vehicles, smart apps, and online advertising, highlight how data and AI shape modern decision-making.
Foundational concepts: truth values, functions, populations, variables, and frequency, are integrated throughout, supported by hands-on coding in Python and Jupyter Notebook using the LogicDS PyPi library. This combination of relatable content, computational rigor, and logical structure transforms how students experience and understand data science.
Visualization & Analysis Tools: We integrate CODAP (developed by the Concord Consortium) alongside standard Pythonic libraries to provide both accessibility and industry alignment. A core emphasis of the LogicDS curriculum is to help students learn Python programming concepts, a foundational skill in data science and modern computing. Students use libraries such as Matplotlib to create scatter plots, visualize data distributions, and explore mathematical functions. Through this, they gain hands-on experience with tools widely adopted in research and industry, reinforcing both computational thinking and real-world data analysis skills.
Instruments for Measuring Data Knowledge & Skills: We have been developing short answer questions based on state standards on computing and on AP statistics tests.
We are also developing a project closely connecting computing and statistics to original data used by Sir Francis Galton, who is credited with introducing the term "regression" and developing the foundation for linear regression analysis in his studies of heredity.
We employ clinical interviews to obtain a deep understanding of students’ learning of our innovative curriculum.
Interdisciplinary Approach: The LogicDS Project rigorously addresses the inherently interdisciplinary nature of data science by implementing a unified, logic- and reasoning-based framework designed to bridge the long-standing divide among computing, mathematics, and statistics in K–12 education. Traditionally, these foundational subjects are taught in isolation, leaving students with fragmented knowledge and little understanding of how they connect. LogicDS directly tackles this problem by introducing mathematical logic as a universal language that binds these disciplines together within a coherent conceptual structure.
This principled, unified approach allows students to explore data science through a common reasoning framework that emphasizes clarity, coherence, and accessibility. By explicitly linking foundational ideas across subjects, the LogicDS framework reduces cognitive load, making it easier for learners to grasp abstract concepts that might otherwise seem unrelated or overly complex.
At the heart of this integration lies the concept of the function, a cornerstone of mathematical logic that naturally connects all three domains. The curriculum systematically builds students’ understanding of functions through four progressive competencies—identifying, reading, writing, and designing functions—collectively known as iFun, rFun, wFun, and dFun. This structure enables students to move from recognizing simple relationships in data to designing their own formal models of computation or statistical relationships, fostering deep interdisciplinary fluency.
The framework also ensures that students encounter these abstract ideas in rich, real-world contexts. Lessons draw on data sets that resonate with high school students—such as music, social media, influencers, and entertainment—allowing them to apply logic and computation to meaningful, culturally relevant problems. Through this contextualization, abstract reasoning becomes tangible and personally engaging.
Finally, programming is seamlessly woven into every aspect of the LogicDS experience. Students use Python and Jupyter Notebook, supported by the LogicDS PyPi library, to visualize data, model relationships, and bring their reasoning to life. By connecting logic, computation, and statistical thinking in a unified framework, LogicDS not only enhances understanding but also prepares students for advanced studies and careers in data science and artificial intelligence, where interdisciplinary fluency is essential.
Challenges and Strategies for Addressing Them: The best opportunity we see is that students demonstrate capacity and potential to understand our new unified approach to traditionally disconnected foundations needed by data science. There is a consensus that data science has foundations in computing, mathematics, and statistics, but at the K-12 level, these subjects are usually taught as standalone courses that are unconnected. Students may struggle to see the necessary relationships between these fields. This traditional separation increases the cognitive load on learners. To leverage this opportunity, we have increased the lessons from 5 to 14, and covered more significant topics in computing and statistics in a way the normal computing or statistics courses are not able to.
Beyond its pedagogical innovations, LogicDS introduces new opportunities in data analysis and educational research. Using the LARA/Activity Player platform, researchers can analyze extensive “learner logs” containing hundreds of thousands of timestamped mouse and keyboard events. These detailed interaction traces enable exploration of both individual and aggregate learning patterns. Through the application of advanced metrics such as Shannon’s entropy and the coefficient of entropy variation (CoV), researchers can quantify engagement and identify behaviors that correlate with higher performance. Early analyses show that students demonstrating greater variability in entropy—reflecting flexible and adaptive learning—tend to achieve stronger outcomes. To leverage this opportunity, we can perfect this analysis method and apply it to our future data.
Initial Findings: The pilot implementation of the LogicDS “Week of Data Science” (WODS) study, conducted in April 2024, involved 132 participants, primarily from rural and underserved communities. Roughly 30% of participants identified as being from rural or small-town areas, with 20% identifying as African American/Black and 27% as LatinX/Hispanic. The pilot utilized six of the seventeen lessons from the LogicDS course to evaluate early impacts on student familiarity, engagement, and learning behaviors.
We report two major findings from this experiment and associated analysis.
This first one is on students' learning of functions which are at the core of data science and our logic based approach. Students naturally grasp the concept of functions from real-world or computational contexts, but it is not trivial to transfer this capacity and understanding to more advanced and abstract mathematical and statistical concepts (as functions). We group the students’ understanding of functions into reading, writing, designing, and programming. Reading refers to evaluating given expressions using functions; students performed consistently well across contexts: 91% correct on the daily-life function viewsOf, 87.7% on the membership function in set theory, and 71.8% on the arithmetic comparison. Writing involves writing expressions using given function specifications to answer questions; while 80.9% correctly wrote expressions for viewsOf, success dropped sharply for sort function (28.4%) and statistical concepts (as functions)(frequency, 23.7%). Designing functions refers to designing a function by specifying its name, inputs, output, and side effects; 51.5% succeeded on the max function, but only 9% and 11% did so for the functions corresponding to the concepts of membership in set theory and variables in statistics, respectively. Function signature tasks assess students’ ability to formalize input and output types of a function; performance ranges from 17–25%. Function as a set of pairs measures understanding of how a function can be represented by input–output pairs, yielding low correct rates (8–20%). Programming involves evaluating or writing Python program using functions; students performed well on computational expressions such as 23 > 15 and max(7, 8, 3, 19) (79–81%), though some struggled with side effects in the assignment function (57%). Qualitative analysis showed that even incorrect responses often demonstrated partial or intuitive understanding, such as near-correct syntax or reasoning through examples.
The other is a discovery of a novel analysis approach. To gain deeper insight into learning dynamics, the research team analyzed student activity logs collected via the LARA / Activity Player (AP) platform using entropy-based metrics. Students were grouped by their Coefficient of Entropy Variation (CoV), which measures the variability of their learning behavior. Results revealed a significant difference in learning performance between students with high and low CoV values (t=2.18, p=0.03), with those showing greater variability performing better overall. This finding suggests that flexibility and adaptability in learning—reflected in more variable engagement patterns—may be positively associated with improved outcomes.
Products: The project website contains a project summary, publications/presentations, and links to course materials.
Suggested Reading:
- Mohamed, R., Mondol, A., Ma, D., Chao, J., Wiedemann, K., Fofang, J. B., Monteith, B., Xing, W., Li, L., Jo, Y., Fleetwood, A., Lipien, L., & Zhang, Y. (2025). How Students Learn Functions in an Integrated Introductory Data Science Module (EasyChair Preprint No. 15867). DSE K-12 Conference 2025, Las Vegas, NV EasyChair. https://easychair.org/publications/preprint/VlxF/open
- Monteith, B., Liu, Z., Chao, J., Wiedemann, K., Fofang, J. B., Li, L., Ma, D., Mohamed, R., Mondol, A., Jo, Y., Fleetwood, A., Lipien, L., Zhang, Y., Xing, W. (2024). Using Entropy Analysis to Explore Student Engagement in an Online High School Data Science Course. Peer reviewed and presented at the inaugural DSE-K12 conference 2025 in Las Vegas, NV TechRxiv. https://www.techrxiv.org/users/815367/articles/1217621-using-entropy-analysis-to-explore-student-engagement-in-an-online-high-school-data-science-course

Invigorating Statistics Teacher Education Through Professional Online Learning (InSTEP)
PI: Hollylynne Lee | Co-PI: Gemma Mojica
Disciplines: Mathematics, Science, Computer Science
Grade Levels: Middle School, High School
Project Description: The InSTEP project, in collaboration with partners at RTI International, designed and developed instepwithdata.org which is an online professional learning platform that supports teachers in developing their expertise to teach data science and statistics in grades 6–12.
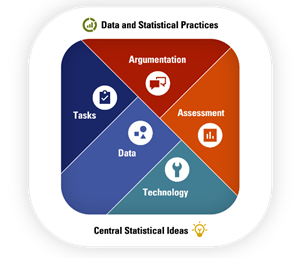 Rather than being a static course to complete, InSTEP offers teachers the flexibility to choose their own learning pathway by engaging with part or all of our learning materials and resources. Teachers and other educators can work at their own pace to build on their knowledge and skills related to important aspects of classroom practice such as selecting appropriate data and statistics tasks, leading productive classroom discussions and choosing technology tools. The platform is organized around key interconnected dimensions of effective learning environments for teaching data science and statistics as illustrated in the diagram.
InSTEP offers two main types of learning experiences for teachers:
- Self-Paced Modules: These modules allow teachers to explore specific dimensions in depth, strengthening both their content knowledge and pedagogical skills. Currently, the platform includes 13 modules across the seven dimensions, with additional modules in development.
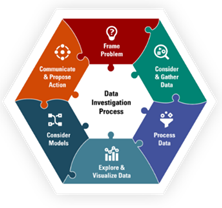 Data Investigations: These are hands-on, inquiry-based experiences where teachers work with “big data” and data visualization tools. Each investigation focuses on a real-world context and involves larger, multivariate datasets. Through these experiences, teachers engage with key Data and Statistical Practices and Central Statistical Ideas, guided by the Data Investigation Process (Lee et al. 2022) framework represented in the puzzle piece figure. There are currently six data investigations.
Data Types: Teachers can work with a range of datasets within InSTEP. Some examples include working with data about roller coasters, fish or nutrition of cereal. These experiences guide teachers through investigations using real world data and the online data tool CODAP. Each investigation includes expert insights, often screencast videos, that ensure teachers can learn and reflect on different strategies, models, and visualizations that are useful in CODAP and in making sense with data. InSTEP also includes resources to support teachers in finding their own data for their classrooms.
Visualization & Analysis Tools: While we try to introduce many tools within InSTEP, the main data analysis and visualization tool used is CODAP. CODAP is a free online analysis tool that supports exploratory data analysis and visualization with connected representations. It is designed with K-12 students in mind to support their sense making with data.
Interdisciplinary Approach: One of the most significant contributions of the interdisciplinary field of data science is providing approaches and tools to solve problems with data. In our work, we developed a framework to guide investigations with data, a Data Investigation Process (Lee et al., 2022). This 6-phase model that highlights the dynamic, often nonlinear process of investigating data to solve a problem or examine real-world phenomena. We emphasize the importance of understanding the context of the problem under investigation which requires one to seek information and often different types of expertise from multiple disciplines. In solving a problem or examining an issue, it is also important to draw on approaches and tools from multiple disciplines. To learn more about the Data Investigation Process, refer to the following resources: Data Investigation Process, Thinking Through the Data Investigation Process, and Investigating Data Like a Data Scientist: Key Practices and Processes.
Products:
- Project Websites
- Lee, H. S., Mojica, G. F., & Thrasher, E. (2022). Digging into data: Illustrating an investigative process. Statistics Teacher (online serial). https://www.statisticsteacher.org
- Lee, H. S., Thrasher, E., Mojica, G. F., Graham, B. M., Lee, J. T., & Kuhlman, A. (2024). Examining teachers’ professional learning in an online asynchronous system: Personalized supports for growth and engagement in learning to teach statistics and data science. Education Sciences, 14(11), 1236. https://doi.org/10.3390/educsci14111236.
- Thrasher, E., Lee, H. S., Mojica, G. F., & Graham, B. (2024). Making Sense of Data Visualizations: A Toolkit for Supporting Students. Statistics Teacher, Fall 2024 issue. Available online https://www.statisticsteacher.org/2024/12/09/data-visualizations/
Learning How to Help Middle Grades Science Teachers Integrate Data Exploration and Sensemaking in the Classroom
PIs: Jonathan Griffith, Joshua Rosenberg | Co-PIs: Jessica Bean, Anne Gold, Kristin Hunter-Thomson, Kerri Wingert
STEM Disciplines: Climate Science, Ecology, Natural Hazards
Grade Levels: Middle School
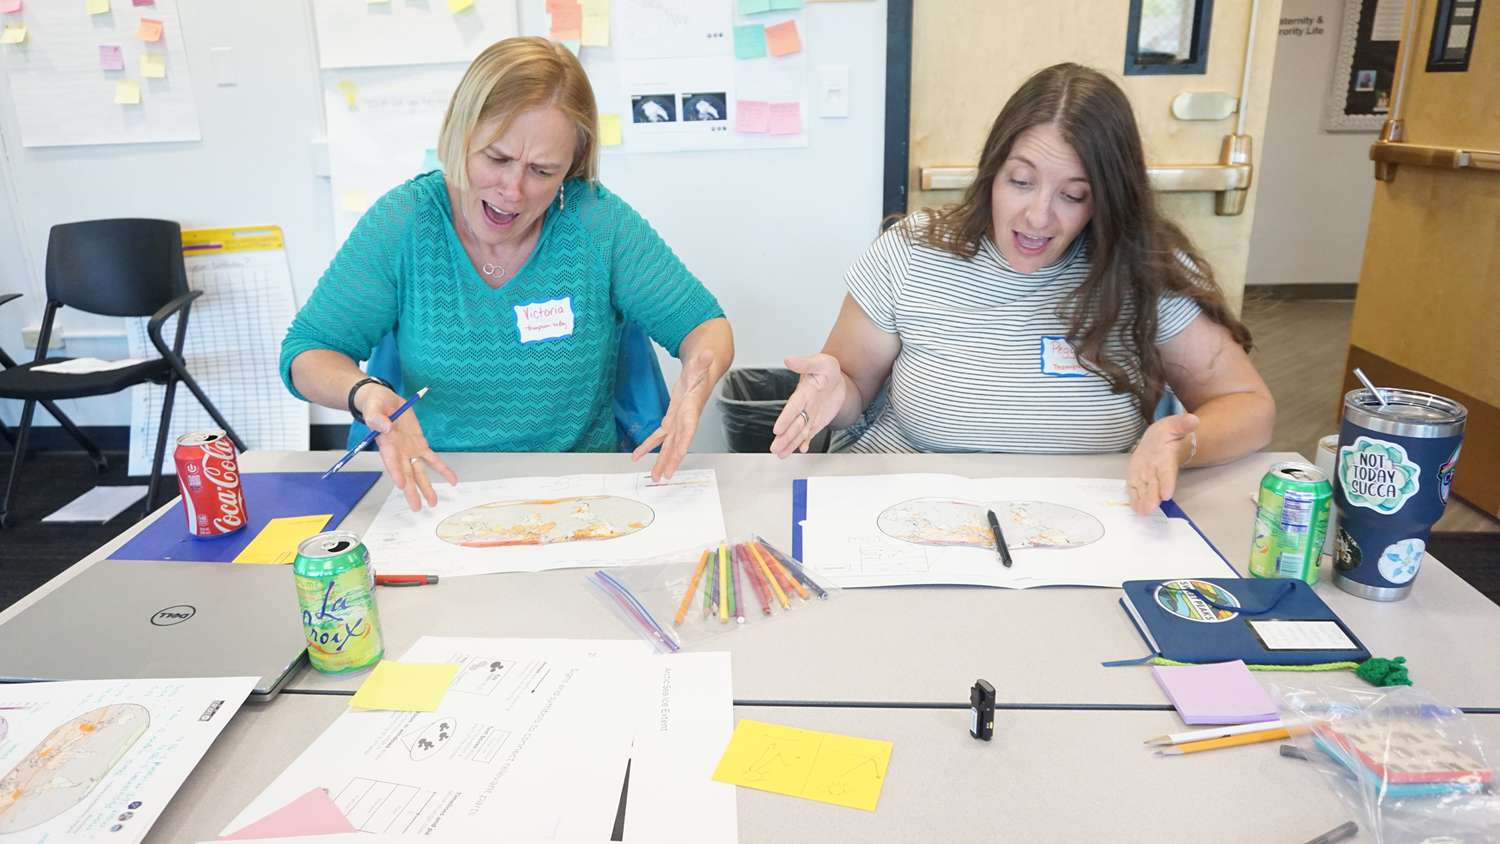
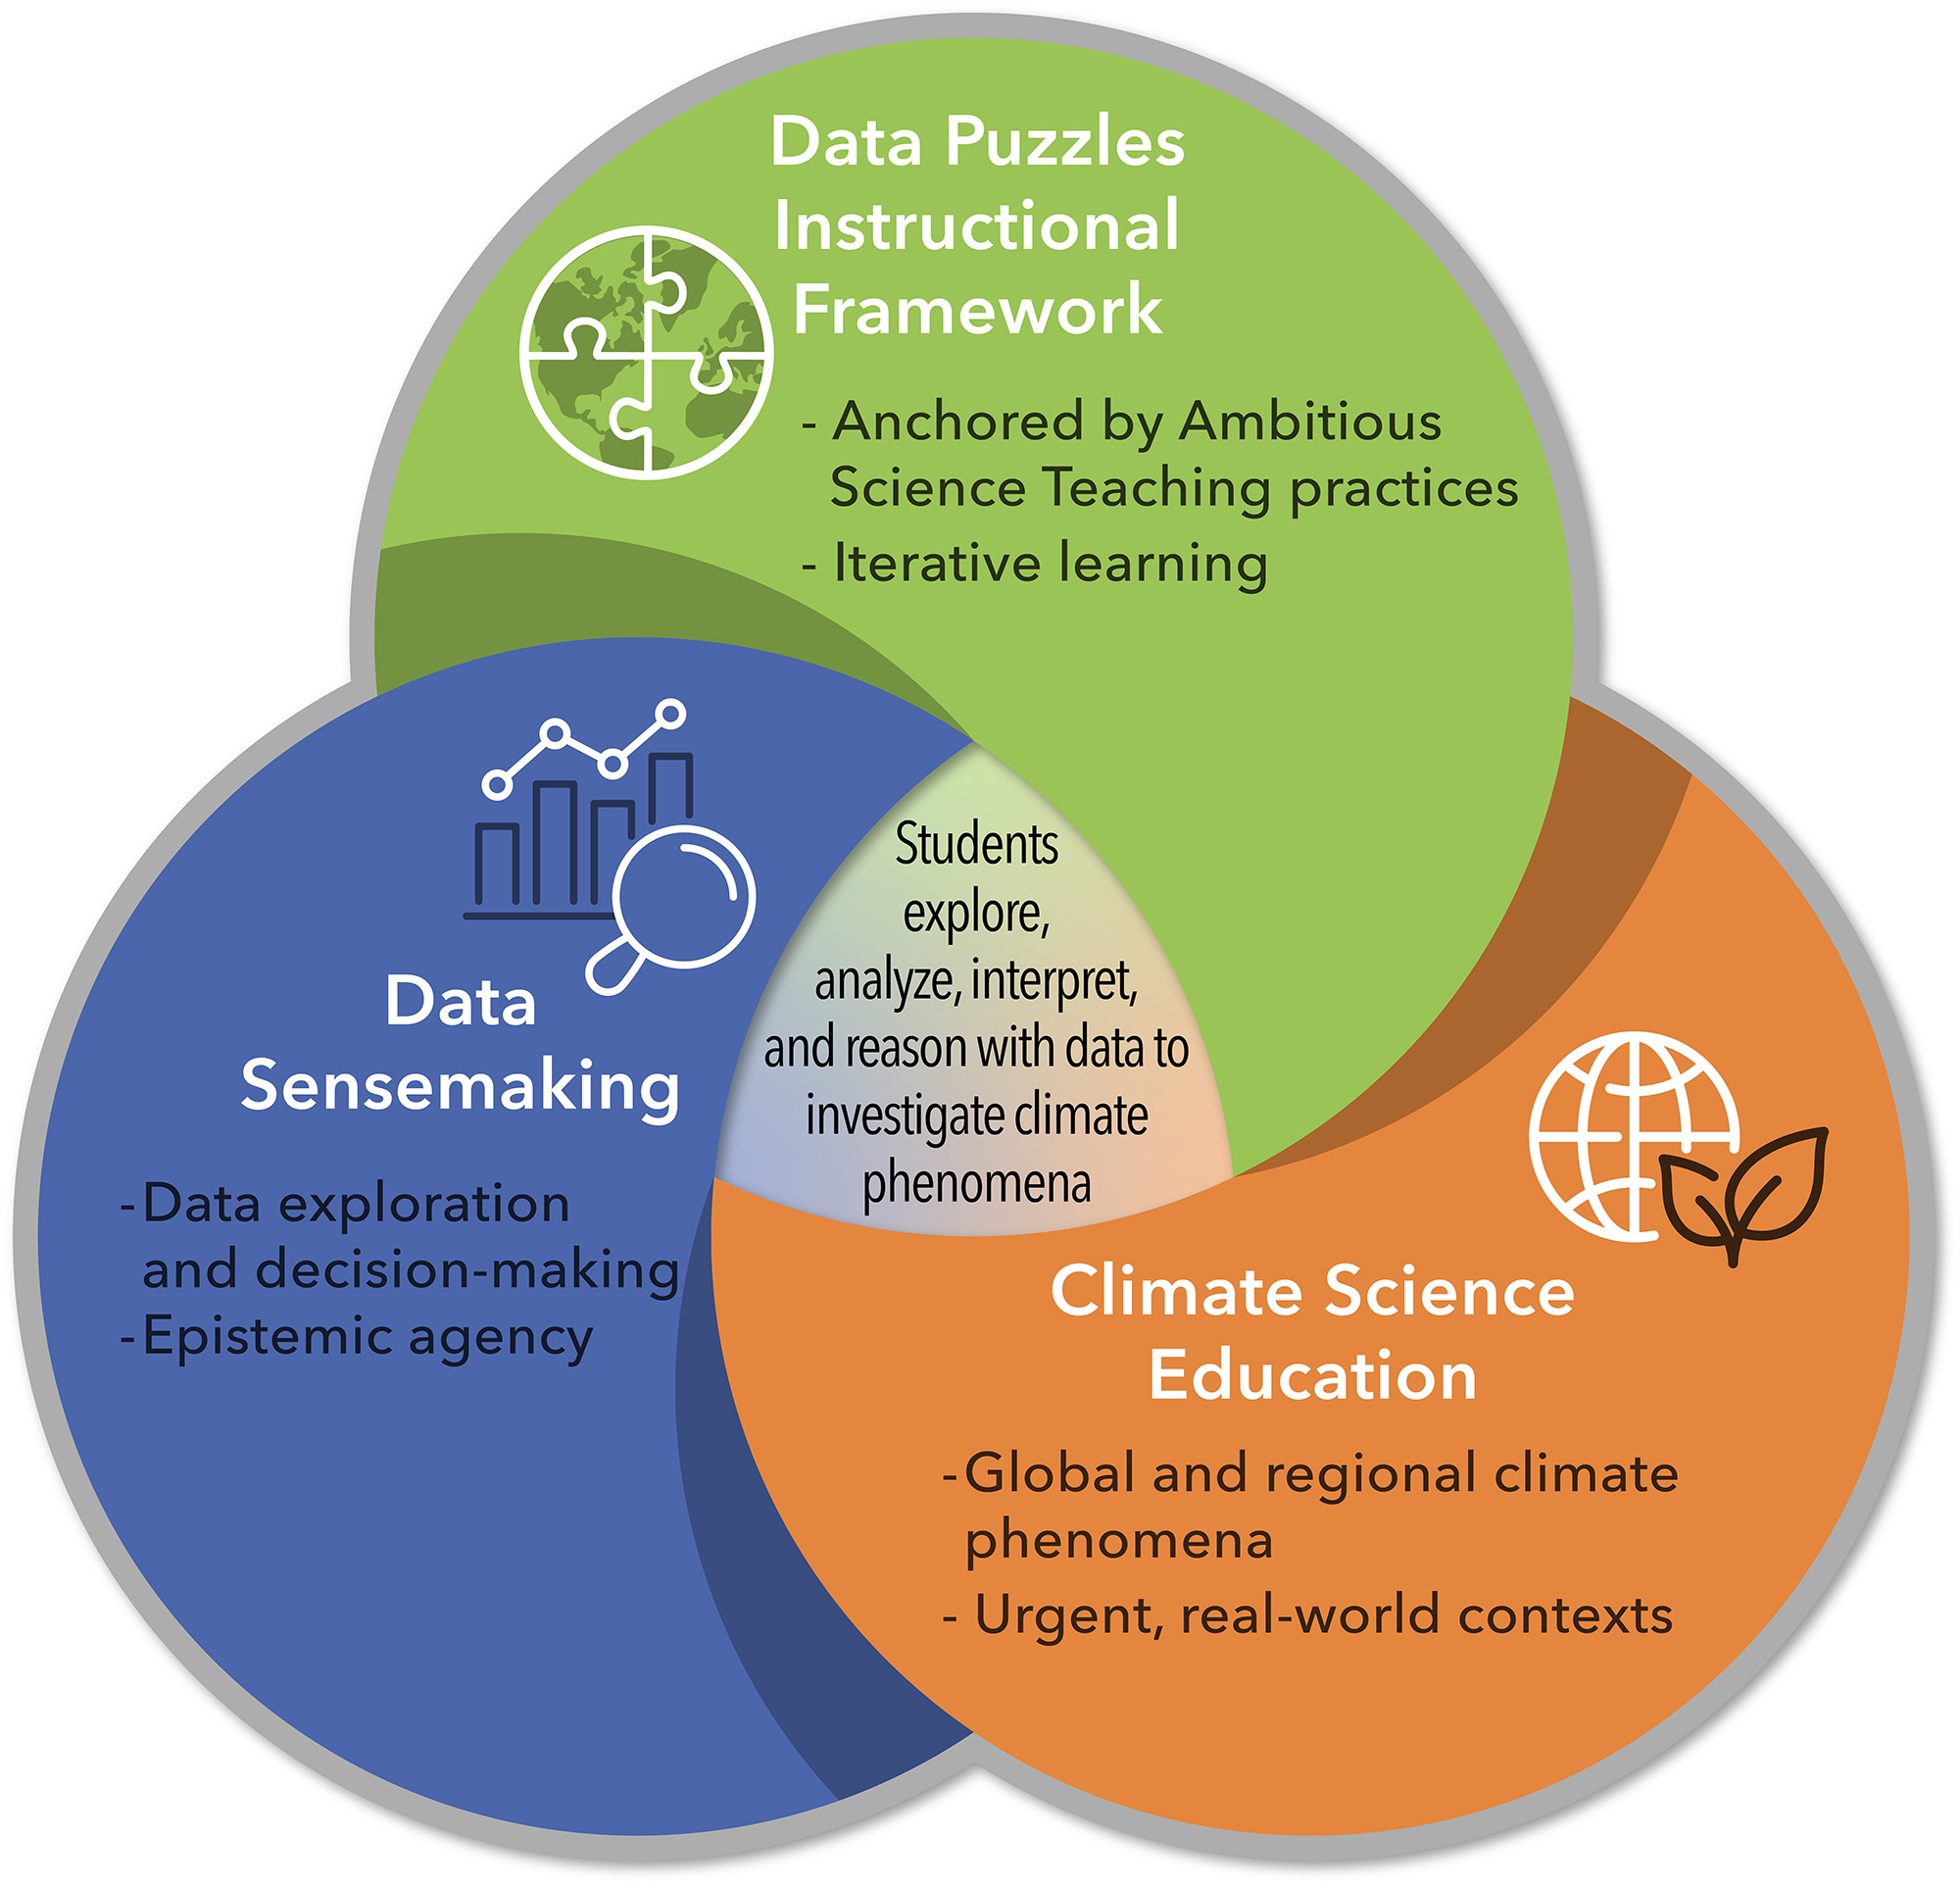
Project Description: Building on the existing Data Puzzles instructional framework (see Data Puzzles homepage in “Products”)—which integrates classroom-friendly climate science data with Ambitious Science Teaching practices—the Building Research-based Instruction for Data Sensemaking in Grades 6–8 Education (BRIDGE) project aims to grow middle school science teachers’ confidence in using and teaching data sensemaking skills in structured (Data Puzzle lessons) and open-ended data investigations (Puzzle Pieces) by developing, implementing, studying, and iteratively refining a professional learning (PL) model consisting of two modules. Each module consists of a multi-day summer workshop, with subsequent monthly virtual meetings. In June 2025, a cohort of 19 MS science teachers from the Colorado Front Range met for module 1 during a 3-day in-person workshop. The experience was intentionally designed to give participants time in “adult learner hat” to investigate and make sense of data, climate science concepts, the Data Puzzles instruction framework, and their intersections (see initial project findings). This cohort continues to meet monthly to further explore these intersections and provide ongoing support during classroom implementation of scaffolded Data Puzzle lessons. In June 2026, the same group will participate in module 2, applying their data sensemaking skills to open-ended data explorations using Puzzle Pieces activities that leverage CODAP to allow users to explore data and build data visualizations. Like module 1, module 2 includes a 3-day workshop and ongoing virtual collaboration. We are also adapting and delivering the PL model virtually to a second teacher cohort, creating a scalable, research-informed model for data-focused PL.
Data Types: The Data Puzzle lessons and Puzzle Pieces leverage real-world climate science data to invite students to explore climate change across disciplines (access lessons and Puzzle Pieces via the Data Puzzles homepage linked in the Products section). Rather than teaching data science activities out of context, Data Puzzles contextualize data sensemaking within the work of the cutting-edge CU Boulder and NOAA scientists. For example, The “Not All Warming is Equal” lesson uses data collected by atmospheric scientist Dr. Jen Kay as part of the NASA-funded Clouds and Earth’s Radiant Energy System (CERES) project to model the inputs and outputs of radiation at the Earth’s poles.
Visualization & Analysis Tools:
- The structured Data Puzzle lessons present climate data to learners in pre-made, classroom-friendly data visualizations including scatter plots, bar graphs, line graphs, pie charts, and geospatial maps. Each lesson includes a specific research-backed strategy (e.g., slow reveal, zoom in” that supports students in describing visual patterns in the data.
- The open-ended Puzzle Piece activities present climate data in table form via CODAP that invite students to actively explore the data and leverage an even wider range of data sensemaking practices. Users are then able to explore the data by building their own data visualizations, thereby making exploratory data analysis accessible to middle school teachers and students.
Instruments for Measuring Data Knowledge and Skills: We have a multi-instrument design to understand student data sensemaking and potential impacts on their data science trajectories. It includes a number of surveys and interviews, but the data we are most excited about are video student interviews about their sensemaking processes with these resources, and classroom video that supports us to understand how the instructional model is working. We are developing cases from the video about how teachers can build coherent sequences of instruction with Data Puzzles lessons and Puzzle Pieces activities.
Interdisciplinary Approach: The climate datasets integrated into Data Puzzle resources come from a wide range of climate science disciplines including plant biology, fire ecology, Arctic climate science. Scientist speakers representing this range of disciplines have participated in module 1, joining the in-person workshop and subsequent monthly meetings to discuss their science, data collection methods, and statistical backgrounds in the context of Data Puzzle resources (lessons and Puzzle Pieces). Included in the “Products” section is a recording of fire ecologist Dr. Jennifer Balch speaking to cohort 1 in June 2025 about her recent Science publication focused on fast-moving and destructive wildfires.
Initial Findings: Our initial findings from the June 2025 in-person workshop suggest that when PL experiences deliberately engaged teachers in an “adult learner hat,” their confidence in data sensemaking, climate science, and the instructional framework significantly increased. Teachers reported that working directly with climate data and experiencing inquiry as adult learners—rather than as students or teachers—was the most valuable aspect of their learning. The findings suggest that purposeful PL design elements, such as limiting access to lesson plans and refocusing teachers on content exploration, can create productive spaces for teachers to wrestle with their own uncertainty and build the knowledge and practices needed for data-rich science instruction.
Products:
- Data Puzzles Homepage
- Dr. Jennifer Balch Recording
- Data Puzzles newsletter announcing the BRIDGE project (follow our newsletter for project updates)
- Griffith, J., Grammel, T., Hunter-Thomson, K., DeMarche, M., Gold, A., Thurber, A. (2025). From Puzzles to Discovery: Building Students’ Data Sensemaking Skills Through Authentic Science Investigations. The Science Teacher (accepted).
Suggested Reading:
- Griffith, J. G., Braaten, M., Dubick, A., & Gold, A. U. (2024). From Windy Day Stories to Wind Farms of the Future: Leveraging Student Resources to Make Sense of Phenomena with Data Puzzles. Science Scope, 47(2), 25–33. https://doi.org/10.1080/08872376.2024.2314669
- Hunter-Thomson, K. (2025). How Can We Help Students Explore Data in Their Sensemaking? (Data Literacy 101). Science Scope, 48(1), 7–11. https://doi.org/10.1080/08872376.2024.2433397
![]()
Supporting High School Students and Teachers with a Digital, Localizable, Climate Education Experience
PI: Lindsey Mohan | Co-PIs: Emily Harris, Frank Niepold, Catherine Stimac
Disciplines: Climate Change
Grade Levels: High School
Project Description: Climate Education Pathways addresses a fundamental challenge in climate education: how do students connect global climate science to local impacts and action? To address this challenge, the project developed a 6-week high school unit consisting of a "base unit" focused on foundational global climate science (approximately 75% of the unit) and a teacher-designed local pathway with community-relevant learning experiences (approximately 25% of the unit). The base unit materials focus on fundamental climate science including global temperature changes, greenhouse gases, and carbon cycling. Students engage with real climate data through interactive digital tools, exploring temperature trends, greenhouse gas concentrations, and the carbon impact of potential solutions. The local pathway includes a teacher-designed unit launch focused around a community-specific climate phenomenon (e.g. declining orca and salmon populations in the Pacific Northwest) and a solutions-oriented culminating task (e.g. salmon habitat restoration). Sixty hours of professional learning supported teachers in customizing the local pathway for their community context. Base unit materials, local pathways and design tools are available as OER on the project website.
To examine the unit's impact on student outcomes, we implemented a cohort-controlled quasi-experiment in which teachers served as their own controls. We measured three dimensions of students' environmental science agency (ESA)––three-dimensional sensemaking about climate change phenomena, taking on roles in collective work, and using science as a foundation for change––to determine how localized climate instruction influenced ESA outcomes compared to business-as-usual climate instruction. The study included 2,062 students across 143 classrooms taught by 25 participating teachers.
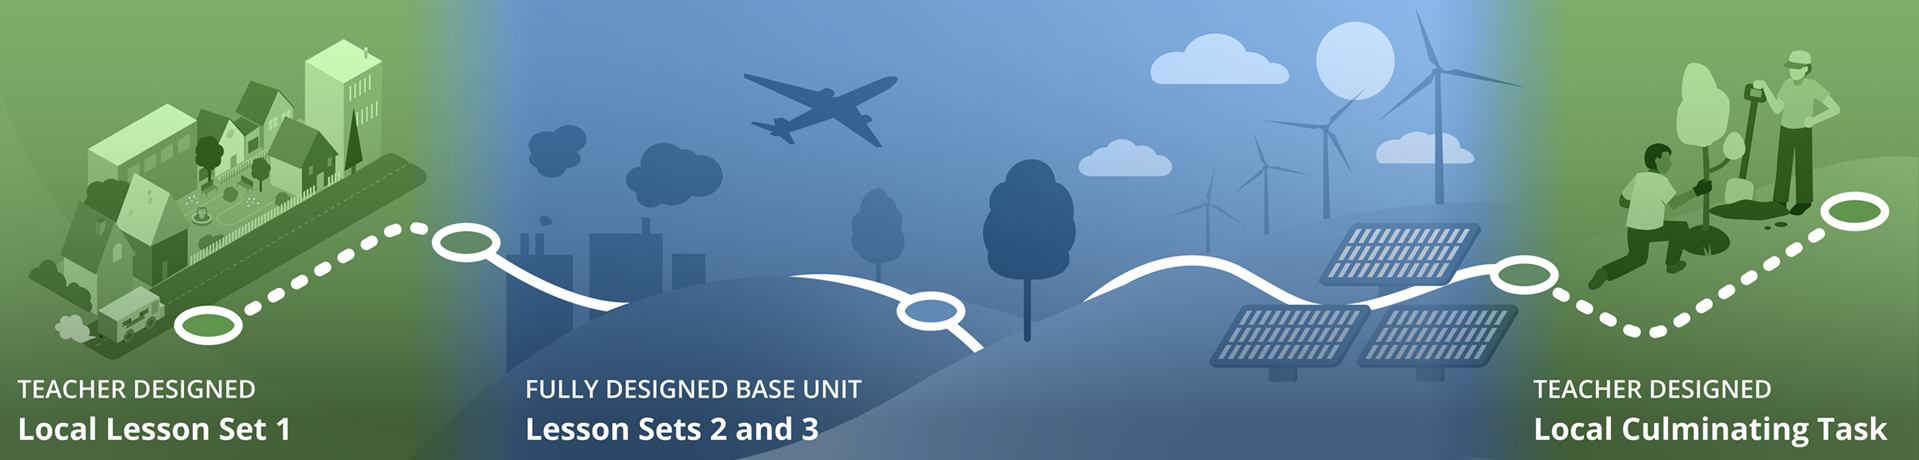
Interdisciplinary Approach: Students engage with real-world climate data through custom visualization tools we developed, drawing from NOAA's Global Monitoring Lab (GML), NOAA's National Center for Environmental Information (NCEI), and Project Drawdown. The tools support student inquiry into climate patterns, such as toggling between data displays that emphasize short-term fluctuations year-to-year and long-term climate trends.
In the first lessons of the local pathway, teachers add their local average annual air temperature data from the NCEI for the recorded history in their place. This feeds directly into the base unit, where students then investigate average annual air temperature using a visualization tool featuring historical data from seven GML sites across the U.S. This tool enables students to distinguish between year-to-year temperature fluctuations and long-term trends, helping students make sense of cooler or warmer years within the context of overall temperature increases spanning 30+ years of records. Later, students revisit this temperature data alongside GML greenhouse gas concentrations data across the recorded history. Students observe a correlation that positions them to investigate the causal relationship between greenhouse gases and atmospheric temperature.
In subsequent base unit lessons, students analyze the impact of various greenhouse gas reduction and drawdown solutions using data from Project Drawdown. This data tool embeds contextual information about each solution, enabling students to engage in evidence-based debates about both carbon impact of the solution and social viability given trade-offs involving socio-economic factors.
The project explicitly addresses the interdisciplinary nature of working with climate data in two key ways. First, the tools foreground how climate solutions cannot be evaluated on scientific merit alone—students must consider economic, social, and equity dimensions when assessing solution feasibility. Second, the local pathway supports teachers to design materials with local data (including temperature data and other data relevant to the community-specific climate phenomenon), positioning students to synthesize global data within the context of how changes in the atmosphere are impacting their communities.
Initial Findings: Our research compared ESA outcomes between high school students who experienced their teacher's business-as-usual climate change unit versus those who experienced the localized Climate Education Pathways unit. The study revealed significant positive effects in two critical areas: students’ three-dimensional sensemaking about climate change phenomena and students’ foundation for change, the sense they could use science to make change in their life or community. We found that students who experienced the localized curriculum showed substantially higher performance on the three-dimensional climate change transfer task compared to those in traditional instruction (Hedges’ g = 0.278). Based on the What Works Clearinghouse Improvement Index, students who participated in the localized unit would be expected to outperform their peers by 11 percentage points on average in assessments of climate science understanding. We found similarly significant improvements in students' foundation for change (Hedges’ g = 0.126). Students experiencing the localized curriculum showed distinctly higher scores in this area, with the Improvement Index indicating they would outperform peers by 5 percentage points on average. The third dimension, taking on roles in collective work, did not show significant differences.
Products:
- Climate Education Pathways Website
- Climate Education Pathways Research and Design Presentations
- Climate Education Pathways Student Edition
- Climate Education Pathways Teacher Edition
- Example Data Interactives
- Example Videocases for Lessons in Action
Additional Projects
We invite you to explore a sample of the other recently awarded and active work with a focus on data literacy and data science education.
- CAREER: Cultivating Environmental Science Data Agency Through Data Storytelling and Issue-Based Learning (PI: Li Ke)
- CAREER: Designing Meaningful Learning Experiences for Statistical Literacy in Secondary Mathematics (PI: Travis Weiland)
- CAREER: Developing Elementary Teachers’ Self-Efficacy to Teach about Climate Change Using Community-Based Practices (PI: Amal Ibourk)
- CAREER: Expanding Latinxs' Opportunities to Develop Complex Thinking in Secondary Science Classrooms through a Research-Practice Partnership (PI: Hosun Kang)
- Conference: Advancing the Field of Data Science in the Early Childhood Years (PI: Marisa Wolsky)
- DataX: Exploring Justice-Oriented Data Science with Secondary School Students (PI: Cassie Scharber)
- Fostering Computational Thinking Through Neural Engineering Activities in High School Biology Classes (PI: Ido Davidesco)
- Fostering Virtual Learning of Data Science Foundations with Mathematical Logic for Rural High School Students (PIs: Xing, Zhang)
- Geological Construction of Rock Arrangements from Tectonics: Systems Modeling Across Scales (PI: Amy Pallant)
- Integrating the Statistical Investigation Process, Data Visualization, and Simulation into High School Statistics (PI: Soma Roy)
- Mentoring a Diverse Cohort of Postdoctoral Scholars in Data Science Education Research (PI: Rachel Levy)
Related Resources
- Additional DRK-12 Publications:
- Advancing Social Justice Learning Through Data Literacy
Students need “critical data literacy” skills to help make sense of the multitude of information available to them, especially as it relates to high-stakes issues of social justice. The authors describe two curriculum modules they developed—one on income equality, one on immigration—that help students learn to analyze data in order to shed light on complex social issues and evaluate claims about those issues. - Building Toward Critical Data Literacy with Investigations of Income Inequality
To promote understanding of and interest in working with data among diverse student populations, we developed and studied a high school mathematics curriculum module that examines income inequality in the United States. - Challenges and Opportunities in Teaching and Learning Data Literacy through Art
We explore art as an accessible and personally relevant approach to developing middle school students’ data literacy. We designed and implemented a 2-week long arts-integrated unit in a grade 7 classroom. - Climate Education in Secondary Science: Comparison of Model-based and Non-Model-based Investigations of Earth’s Climate
In this mixed method study, we analyse the effectiveness of two pedagogical approaches – one model-based and another non-model-based – for developing secondary students’ understanding of the phenomenon of increase in Earth’s average surface temperatures, a core dimension of global climate change (GCC). - Dancing with Data: Embodying the Numerical and Humanistic Sides of Data
We explore the implementation of a co-designed data-dance unit in which middle school students created their own embodied metaphors to represent and communicate about graphs through dance. - Efficacy of a First-Grade Mathematics Intervention on Measurement and Data Analysis
This study investigated the efficacy of the Precision Mathematics Level 1 (PM-L1) intervention, a Tier 2 print- and technology-based mathematics intervention designed to increase first-grade students’ conceptual understanding and problem-solving skills around the areas of measurement and data analysis. - "I Happen to Be One of 47.8%": Social-Emotional and Data Reasoning in Middle School Students' Comics about Friendship
In this paper, we explore the implementation of a co-designed data comic unit about adolescent friendships. - Promoting Students’ Informal Inferential Reasoning Through Arts-Integrated Data Literacy Education
The purpose of This study is to describe synergies and tensions between data science and the arts, and how these can create or constrain opportunities for learners to engage in informal inferential reasoning.
- Advancing Social Justice Learning Through Data Literacy
- Related Spotlights:
- Resources from Other NSF Networks
- STEM for All Multiplex: Data Across STEM Curricula
- CIRCL: Data Science Education Primer
References
Bartley, K. (2025, May 28). Big data statistics: How much data is there in the world? Rivery. https://rivery.io/blog/big-data-statistics-how-much-data-is-there-in-th…
Dogucu, M., Kazak, S., & Rosenberg, J. M. (2024). The design and implementation of a bayesian data analysis lesson for pre-service mathematics and science teachers. Journal of Statistics and Data Science Education, 33(2), 177-188. https://doi.org/10.1080/26939169.2024.2362148
Kjelvik, M. K., & Schultheis, E. H. (2019). Getting messy with authentic data: Exploring the potential of using data from scientific research to support student data literacy. CBE—Life Sciences Education, 18(2), 1–8. https://doi.org/10.1187/cbe.18-02-0023
Konold, C., Higgins, T., Russell, S.J., & Khalil, K. (2015). Data seen through different lenses. Educational Studies in Mathematics, 88(3): 305-325. https://doi.org/10.1007/s10649-013-9529-8
Kosmyna, N., Hauptmann, E., Yan, Y. T., Situ, J., Liao, X. H., Beresnitzky, A., V., Braunstein, I., & Maes, P. (2025). Your brain on ChatGPT: Accumulation of cognitive debt when using an AI assistant for essay writing task. Preprint. MIT Media Lab. 10.48550/arXiv.2506.08872
Lee, V. R., & Thomas, J. M. (2011). Integrating physical activity data technologies into elementary school classrooms. Educational Technology Research and Development, 59(6), 865–884. https://doi.org/10.1007/s11423-011-9210-9
Manning, S. (2024, July 3). AI’s impact on income inequality in the U.S.: Interpreting recent evidence and looking to the future. Commentary. Brookings. https://www.brookings.edu/articles/ais-impact-on-income-inequality-in-t…
National Academies of Sciences, Engineering, and Medicine (NASEM). (2023). Foundations of data science for students in grades K-12: Proceedings of a workshop. Washington, DC: The National Academies Press. https://doi.org/10.17226/26852
Rosenberg, J., Kubsch, M., Sorge, S., Tautz, S., Pritchard, C., Garner, A., & Xu, Z. (in press). Embracing uncertainty in science: The ABCs of data and the confidence updater. Science Scope.