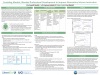
Place-based Learning for Elementary Science at Scale (PeBLES2)
Principal Investigator:
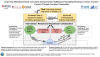
To support equitable access to place-based science learning, the PeBLES2 team is developing and testing a model to support elementary teachers in incorporating locally relevant phenomena into instructional materials intentional designed to be locally-adapted. We are developing two units that could be used in any region across the country with built-in opportunities and embedded supports for teachers to purposefully adapt curriculum to include local phenomena. Professional learning experiences will further help teachers incorporate place-based approaches.
Click image to preview:
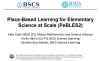
Discipline/Topic:
Target Audience: