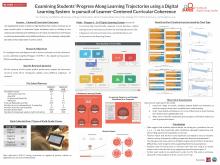
Click image to see poster.
Abstract
Mathematics teachers face two significant challenges: the first is managing the diversity of preparation in classrooms and the second is how to achieve a coherent curriculum when assembling it from open educational resources. MathMapper 6-8 is a digital tool to assist in addressing both, consisting of: 1) a learning map hierarchically structured around nine big ideas unpacked into learning trajectories based on research and aligned with standards, 2) diagnostic assessments coordinated with instruction providing formative feedback on progress on learning trajectories, 3) a set of open curated links coordinated with the map, 4) a scope and sequence tool permitting multiple sequences, and 5) an underlying analytics.
The tool has been developed in partnership with three middle schools, which have field-tested the items. The items are conceptually oriented and are a combination of multiple choice, multiple select, single answer and true/false. Students have taken 15,000 assessments during 2015-16. Data were analyzed by examining heat maps of the results showing the levels (lowest to highest, bottom to top) assessed vertically and the students ordered horizontally (weakest to strongest) on that construct. Each cell is colored on a scale from incorrect to correct. The expectation is to see a Guttman curve in success from bottom to top and left to right. When items performed better or worse than expected, they were examined and the team considered whether there was a problem with the item (difficulty, length of time, reading level, complexity, extraneous content), the trajectory levels, or if the placement fit the learning trajectory but the idea was poorly addressed in curriculum or instruction. IRT models were applied to inform the discussion. During the 2016-17 school year, the diagnostics assessments will be used repeated by 2000 6-8th graders at the three schools providing opportunities to examine the scaling and the patterns of results during a second year.
The poster reports on the student data from three schools with contrasting demographics around two clusters of concepts on ratio. The first cluster consists of fundamental ideas of ratio equivalence, base ratios and unit ratios. The second cluster is comparing ratios and finding missing values. The data produce heat maps that show how students perform between low and higher levels of the trajectory and show performance in easier to more difficult constructs. These data show that 1) student performance is often far weaker than anticipated, and 2) performance on higher level constructs is poorer than on lower. More importantly, teachers report that the data informs them on where to focus their attention, that the problems stimulate compelling discourse, and that students are highly motivated receiving immediate data within an actionable framework. Full use of the tool in the coming year will provide additional insight.
The significance of the work is as a compelling example of putting research into action. At a time demanding more assessment for learning, it provides an example of how interim assessment models can inform instruction, meet personalized educational needs, and guide decision-making and curriculum evaluation.
